• Home
  • Who We Are 
    • Our Story
    • Our Board & Advisory Board
    • Our Students
    • Annual Reports
    • Media
  • Our Programs 
    • English Program
    • Women in Tech (WiT)
    • Professional Skills Development
    • Legacy
  • Get Involved 
    • Students
    • Volunteers
    • Support Us
    • Career
  • Partner With Us
  • Blog
  • …  
    • Home
    • Who We Are 
      • Our Story
      • Our Board & Advisory Board
      • Our Students
      • Annual Reports
      • Media
    • Our Programs 
      • English Program
      • Women in Tech (WiT)
      • Professional Skills Development
      • Legacy
    • Get Involved 
      • Students
      • Volunteers
      • Support Us
      • Career
    • Partner With Us
    • Blog
    DONATE
    • Home
    • Who We Are 
      • Our Story
      • Our Board & Advisory Board
      • Our Students
      • Annual Reports
      • Media
    • Our Programs 
      • English Program
      • Women in Tech (WiT)
      • Professional Skills Development
      • Legacy
    • Get Involved 
      • Students
      • Volunteers
      • Support Us
      • Career
    • Partner With Us
    • Blog
    • …  
      • Home
      • Who We Are 
        • Our Story
        • Our Board & Advisory Board
        • Our Students
        • Annual Reports
        • Media
      • Our Programs 
        • English Program
        • Women in Tech (WiT)
        • Professional Skills Development
        • Legacy
      • Get Involved 
        • Students
        • Volunteers
        • Support Us
        • Career
      • Partner With Us
      • Blog
      DONATE

      Rima Zino - (Business Analytics 1 Course - Spring 2026)

      GENDER PAY GAP VISUALIZER

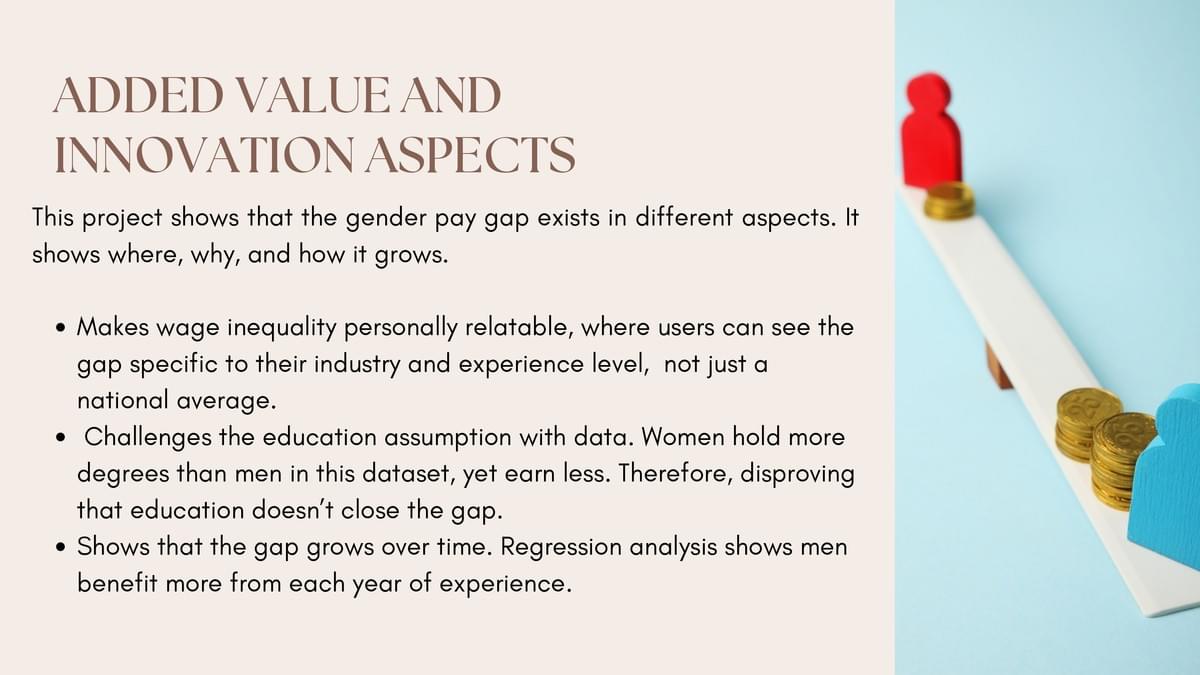
      This project discussed the Gender pay gap challenge, and it focused onturning invisible inequality into visible data.
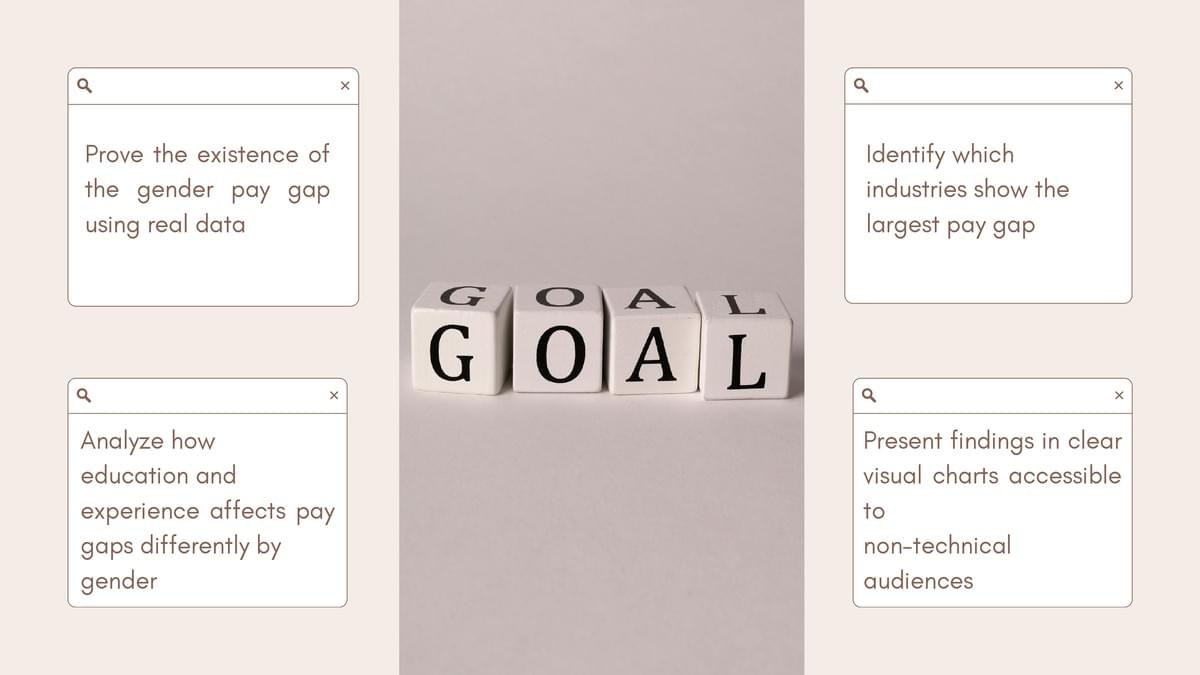
      The goal of it is to:
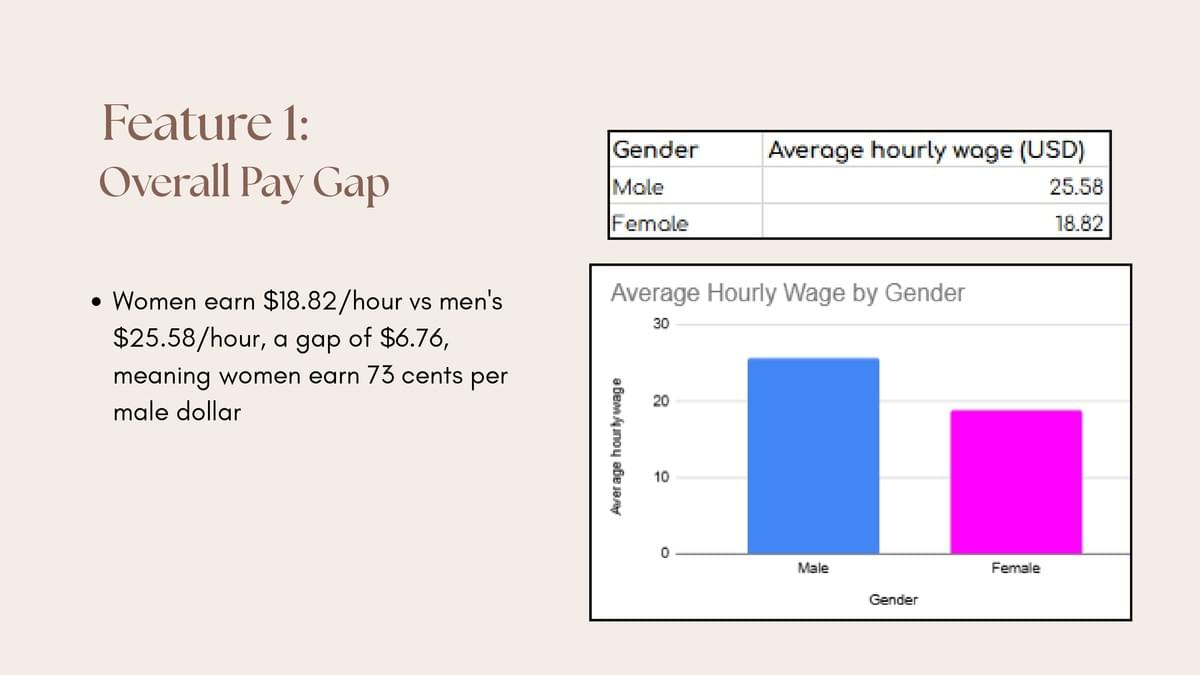
      Prove the existence of the gender pay gap using real data.
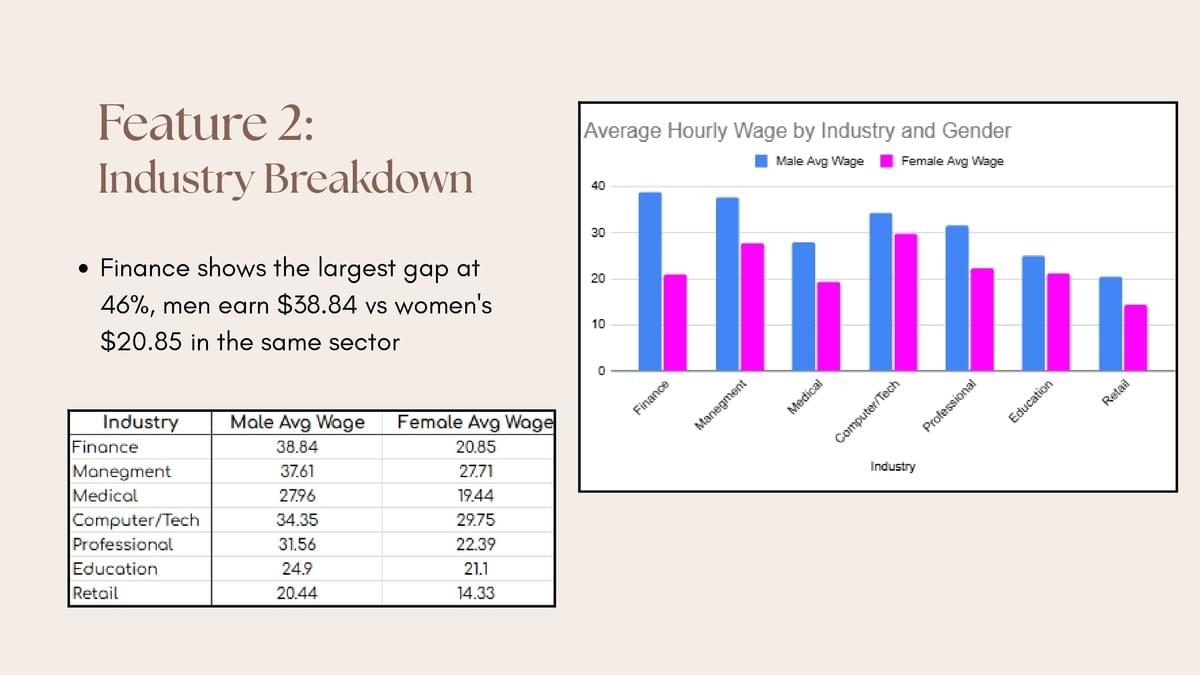
      Focus on the different aspects that affect this gap.
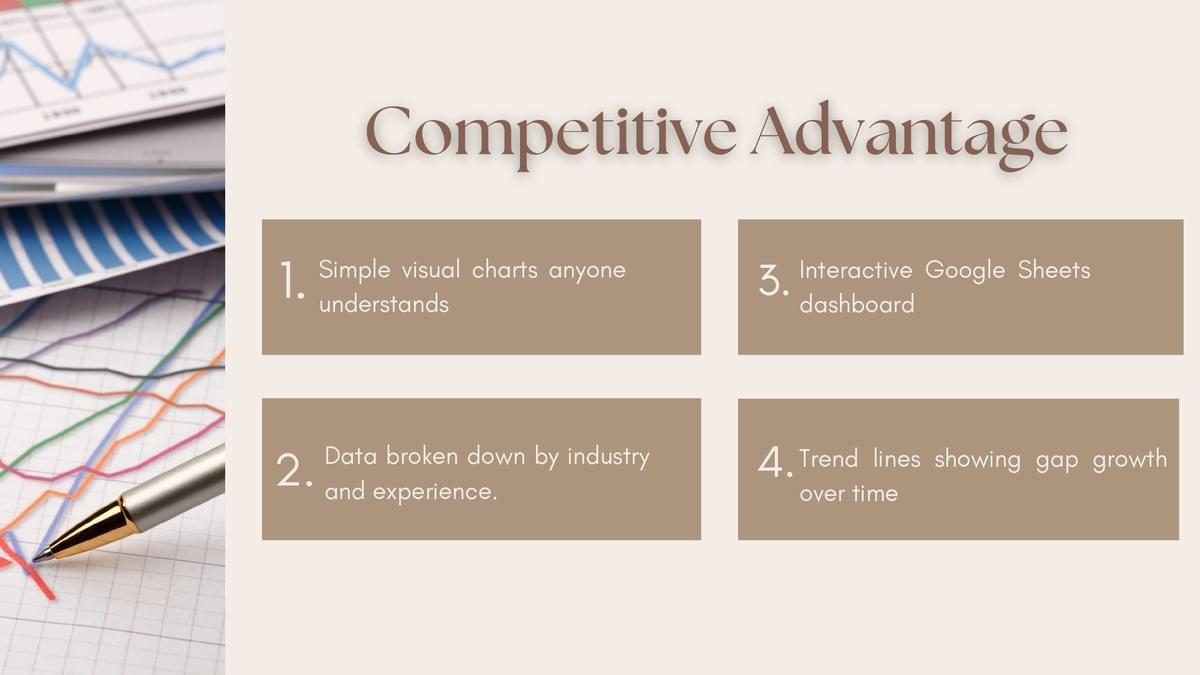
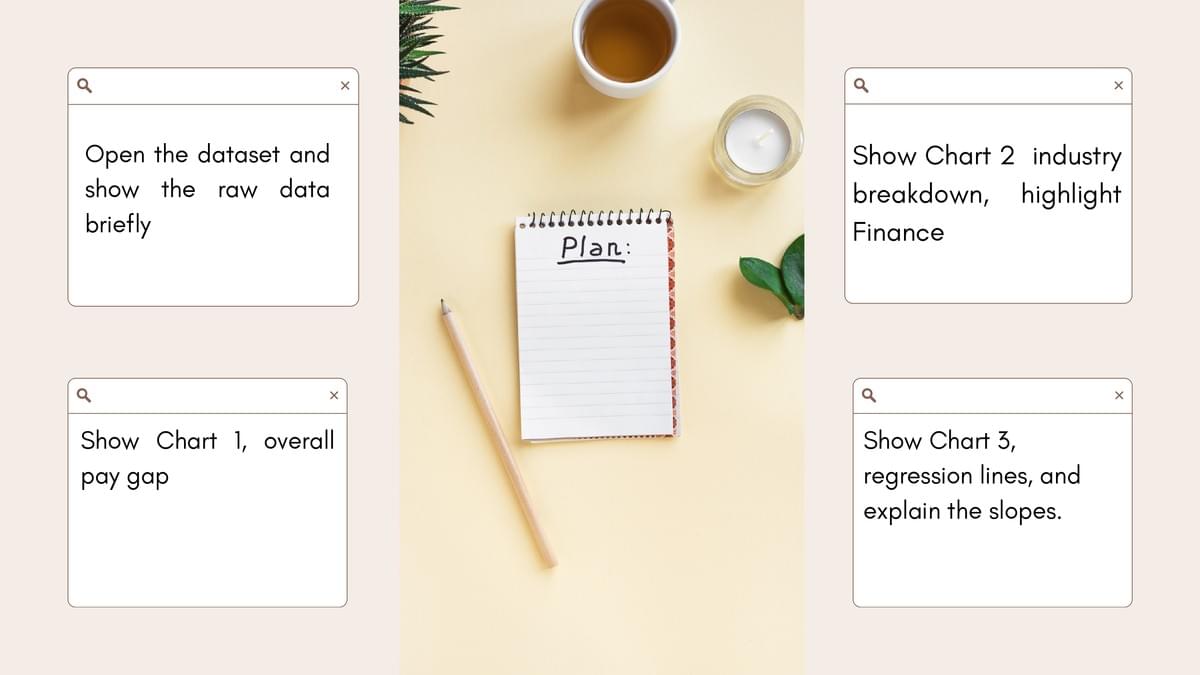
      Present findings in clear visual charts accessible to non-technical people.
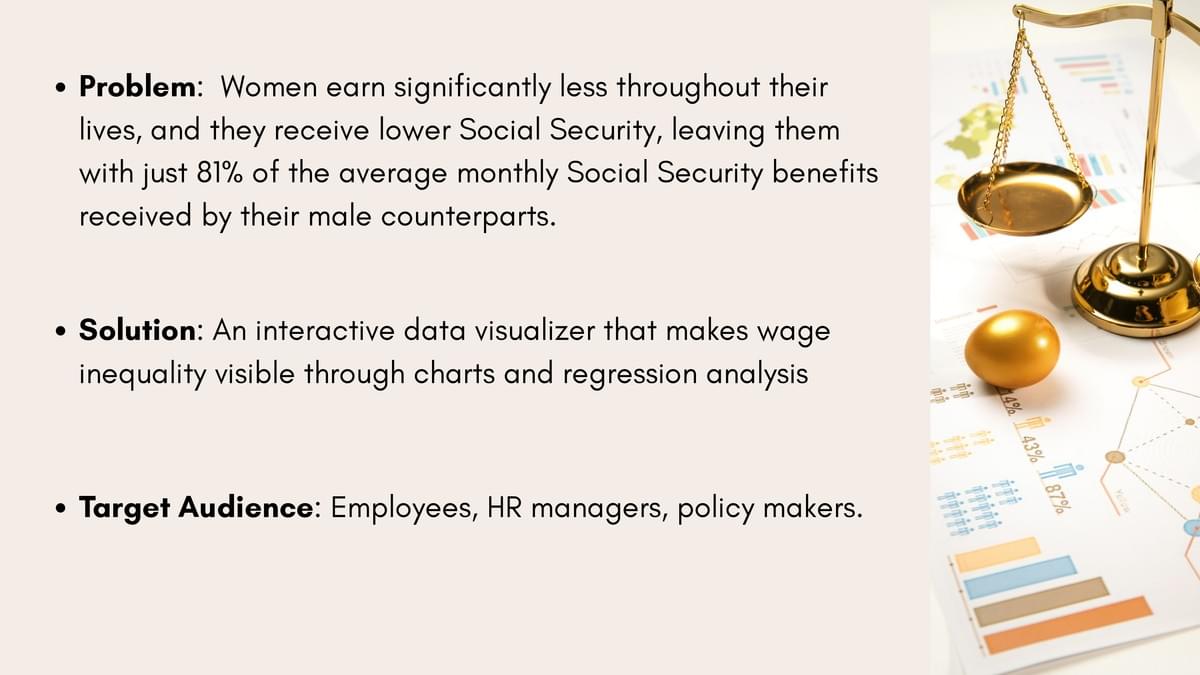
      The target audience for this project is Employees, HR managers, and
      policy makers.
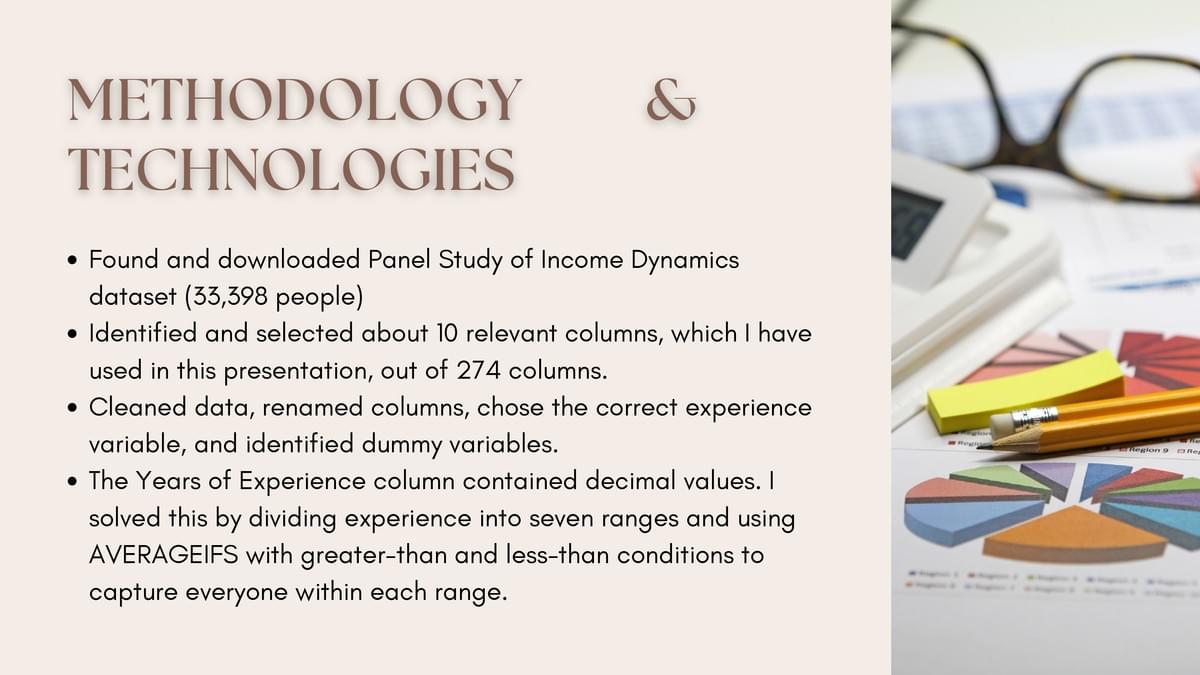
      I have chosen a Panel Study of Income Dynamics dataset (33,398
      people)
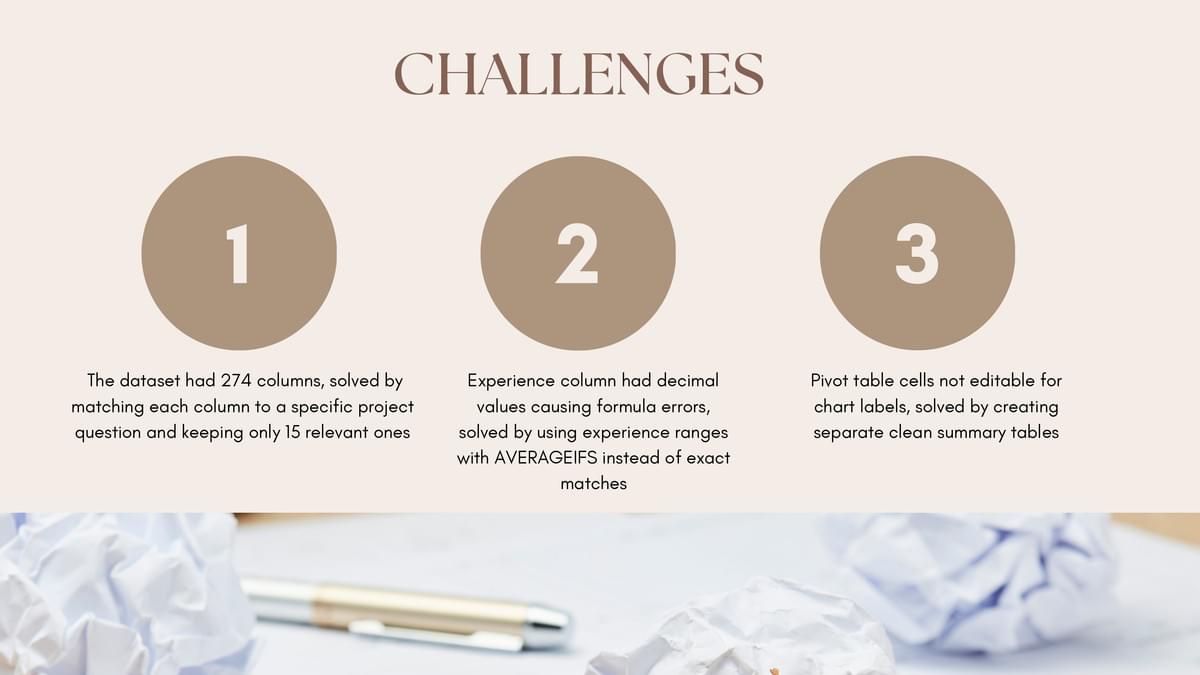
      I have used Google Sheets for data cleaning, pivot tables, AVERAGEIFS
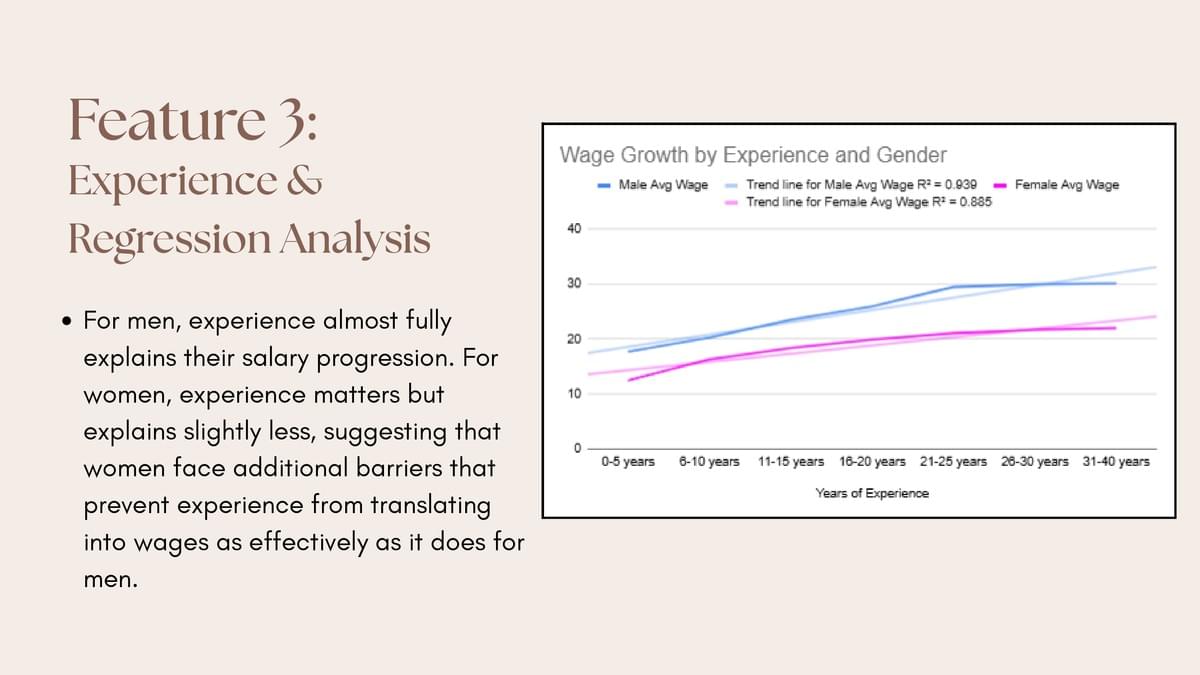
      formulas, and Linear Regression, a trend line analysis method.

      Section image
      Section image
      Section image
      Section image
      Section image
      Section image
      Section image
      Section image
      Section image
      Section image
      Section image
      Section image
      Section image
      Section image
      Section image

      Subscribe
      Previous
      Leen Mustafa - (Business Analytics 1 Course - Spring 2026)
      Next
      Maryam Ahad - (Business Analytics 1 Course - Spring 2026)
       Return to site
      Profile picture
      Cancel
      Cookie Use
      We use cookies to improve browsing experience, security, and data collection. By accepting, you agree to the use of cookies for advertising and analytics. You can change your cookie settings at any time. Learn More
      Accept all
      Settings
      Decline All
      Cookie Settings
      These cookies enable core functionality such as security, network management, and accessibility. These cookies can’t be switched off.
      These cookies help us better understand how visitors interact with our website and help us discover errors.
      These cookies allow the website to remember choices you've made to provide enhanced functionality and personalization.
      Save